Tokens
Every token across the wallets in view, one row per asset, with a page for each token that shows its chart, what it is, and what you hold of it.
The Tokens page lists every asset the wallets in view hold. One row per asset, so ETH held on three chains in five wallets is one row, with the chains it is on marked under its name.
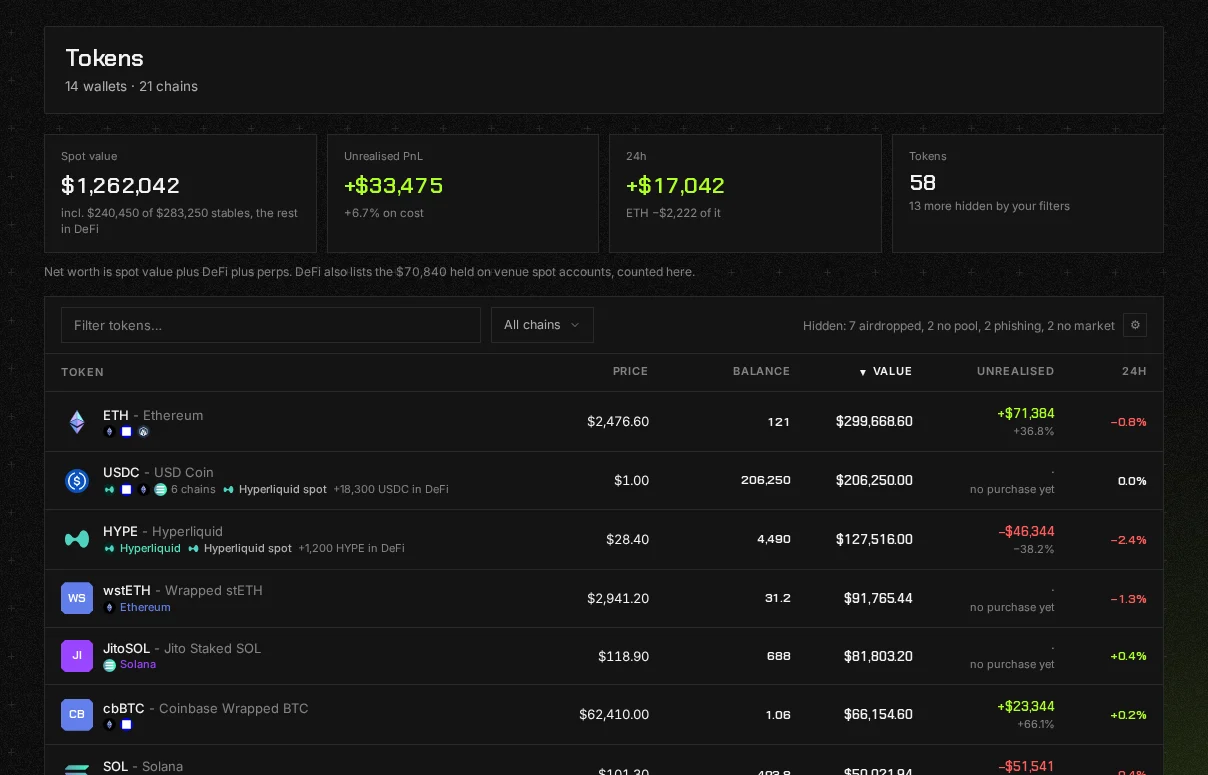
The figures across the top
Section titled “The figures across the top”- Spot value: what the port is worth, DeFi included, and how much of that is stablecoins.
- Unrealised PnL: the gain or loss on what you still hold, against what your trades paid for it. Tokens that arrived by transfer carry no cost and are not in it. If a price we cannot stand behind is inside those lots, the tile says so.
- 24h: how much the port moved in a day, and which token moved it most.
- Assets: how many tokens, and how many holdings across how many wallets.
The table
Section titled “The table”Every column head sorts: token, price, balance, value, unrealised and 24h. The default is by value, biggest first. Type in Filter tokens to narrow by name, ticker or contract address, and pick a chain to see only that chain.
On the right of the filter row, a line says what is being hidden and why, for example how many airdropped tokens and how many with no market. Press it to open the same filters as the cog on Home, plus the phishing switch: small positions, airdrops, tokens with no pool, tokens with no market and phishing. What is not counted, and why explains each.
A token’s own page
Section titled “A token’s own page”Press a row to open the token.
- The chart, over 24 hours, 7 days, 30 days or a year, as an area or a line. A range the token is too young for is shown and cannot be pressed. Where there are market bars for it, candles are offered too. Scroll over the chart to zoom, and your own trades are marked on it.
- About: what the token is. Market cap, fully diluted value, supply, liquidity, volume, the day’s range, the all-time high, holders and where the price comes from, whichever of those a source can answer.
- Actions: Hide takes the token out of your port, Alert writes a rule about it, Replay makes a video of your trades on it (Pro, see below), and the contract address is written out with a copy button and a link to the block explorer.
- Your position: what you hold, in which wallets, and what it cost.
- Activity: every buy, sell and transfer of it in your wallets, filterable, with Export CSV for that token.
Hiding a token
Section titled “Hiding a token”Hide on a token’s page takes it out of every list and every total in your port. Nothing is deleted. Settings › Hidden by you lists everything you have hidden, and Bring back returns it.
Replaying your trades as a video
Section titled “Replaying your trades as a video”Replay on a token’s page plays your trades back on its chart, one by one, with your profit counting alongside, then downloads the result as an MP4 to post wherever you like. It is part of Pro and it works in the browser, not on the phone.
- Whose trades: your whole port, one group, or one wallet.
- Timeframe: by default the stretch around your trades, so a token you traded a year ago and left alone is not a year of flat line. To today runs it to now, and the From and To sliders pick any stretch in between. When the video stops before today, the end card says which day its figure is from.
- Shape: square, wide (16:9) or tall (9:16), each laid out for its shape rather than cropped.
- Chart: candles, a line or an area, against market cap or price. Market cap is the token’s circulating supply today times the price at the time, so it is offered only when the supply is known.
- Amounts: in dollars, or as percentages with every dollar figure left out.
- Sound: a tick on a buy, a till on a sale and a fanfare as your profit passes each milestone, with a switch to turn it off.
The video opens on the token and your dates, then follows your trades up close, the way a trading screen does, rather than squeezing the whole run into one frame, and pulls back to the whole chart for the end card. Each buy and sell lands as a label, like $1.2k BUY ($450k MC), with the chart leaning in on it and a burst sized to the trade, and your profit flashes up each time it passes a round milestone. A buy or a sale through an app such as Fomo or pump.fun counts as a trade too. The figure is your trading profit, first in first out, worked out on our side by the same rule as the PnL page, so the two agree: only buys and sells open and close a position. Tokens someone sent you, or that you sent to another wallet, are drawn as dots and carry no money, so a transfer in is never shown as a purchase at that day’s price, and tokens that arrived that way are not counted as profit while you hold them. A trade with no recorded price is drawn on the chart and left out of the figure, and the video says so under the total. No wallet address is ever drawn, and the Port_ mark sits in a corner of every frame. The video is made in your browser and nothing is stored.
On Home, Replay on the net worth chart does the same for your whole port: your net worth over the year, with your biggest trades marked.
Current browsers make an MP4, which X and Instagram accept. A browser without a video encoder makes a WebM file instead, and the dialog says so, because both platforms refuse WebM.
What it will not do
Section titled “What it will not do”- Match tokens by ticker. Two tokens called USDC on the same chain are two rows, joined by contract address, because a ticker is the easiest thing to fake.
- Hide something because it is small. A microcap you bought is a position however little it is worth. Tokens are hidden for how they arrived and whether anything can price them, never for their market cap.